Analytic Dashboard
A major blind spot on resin 3D printing is lack of measurement tools for 3D manufacturers, resin producers and 3D printing enthusiasts. NanoDLP analytic tool help you to monitor both internal data, external sensors and correlate data from multiple sources.
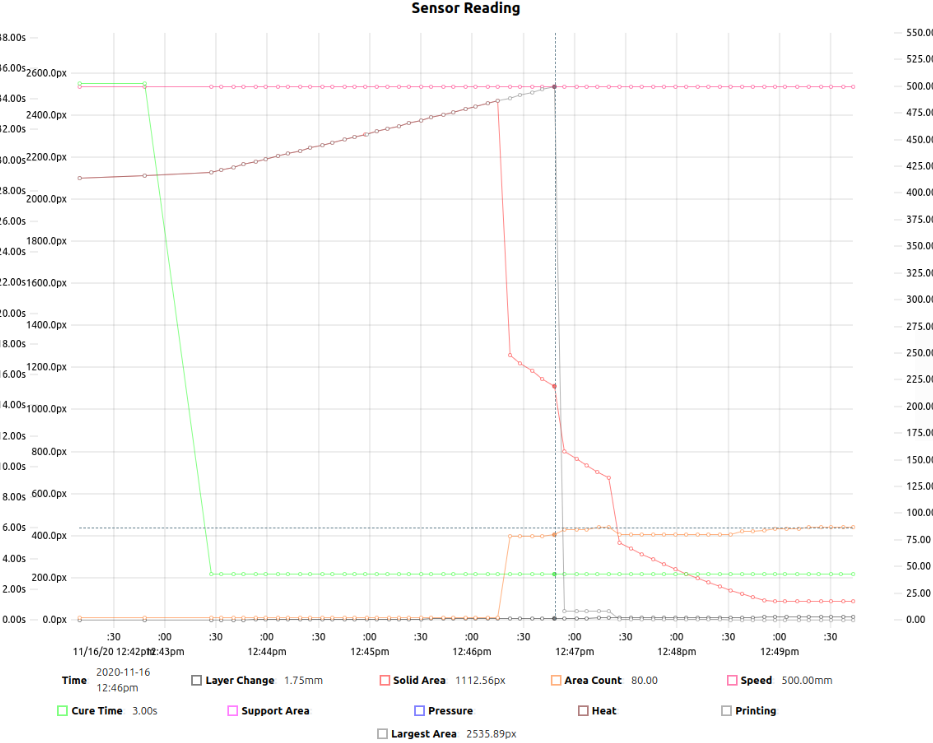
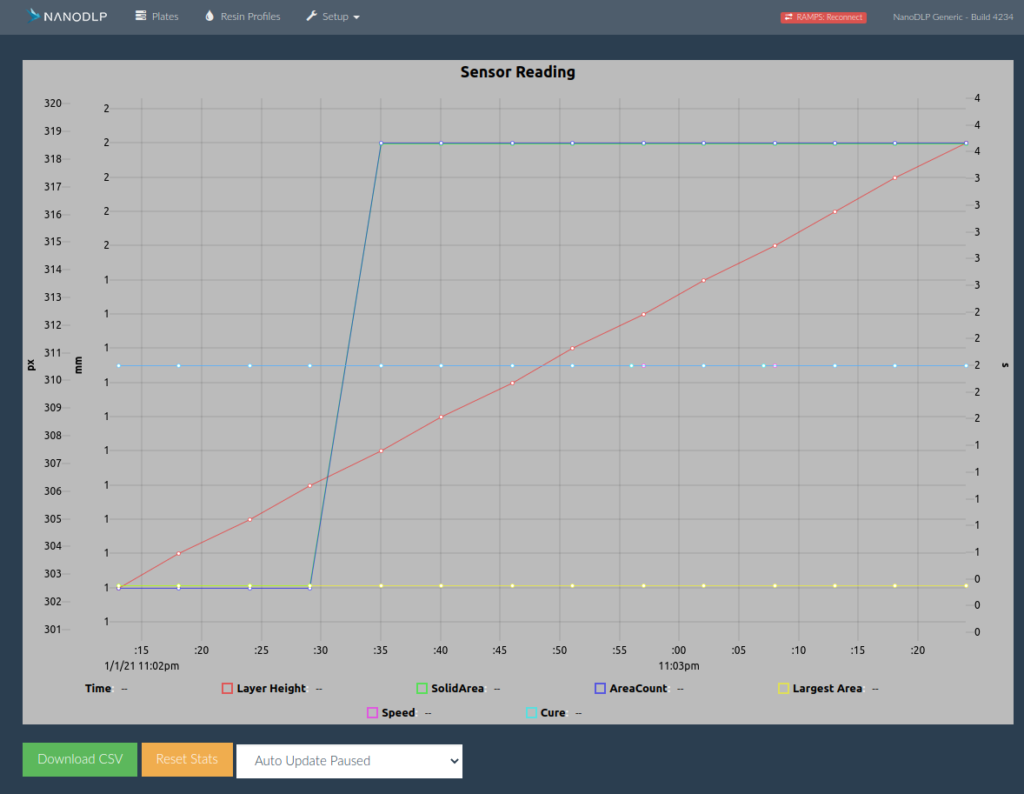
Visualization
NanoDLP helps you visualize all available data on single dashboard.
Available features
- It read values both during idle and printing time. Many KPIs only available during printing.
- Both realtime monitoring and long term KPI visualization available
- Ability to reset collected data
- CSV export
Sources
Internal
Currently possible to see realtime flow of data from current sources:
- Slicer data
- Solid Area
- Area Count
- Largest Area
- Current layer information
- Cure time
- Speed
- Support or Normal layer
External
External sources many sensors that could be read such as
- Moister
- Resin Level
- Driver Ampere
- Light Intensity
- Pressure
- Temperature
Currently common sensors and platforms already supported
- HX711
- OpenScale
- Serial Device Reading (Comma Separated)
How to use it?
You can go to setup menu / tools page then click analytic dashboard button. Data collection will start only after visiting this page.